

Chris Golec shares key takeaways and lessons learned when measuring and comparing digital performance. Plus key performance indicators to consider for efficient measurement.
5 Surprising Takeaways from B2B Campaign Benchmarking (that your vendors won’t share)
Over the last 15 years, I’ve built a variety of ABM, martech and adtech solutions for B2B marketers and had the opportunity to work with some of the best agencies and fastest growing companies. But even among the savviest B2B marketers, I saw a massive range in digital performance that revealed at least 50-60% of budgets were being wasted. By “wasted,” I mean that across the board, up to sixty percent of marketing investments are allocated towards accounts and audiences unlikely to make purchases. Even with all the advances in technology built to improve targeting efficiency, I knew marketers needed a better way to understand what is really working, and what is not. I set out to expose B2B marketing inefficiencies using a new set of measurements an apples-to-apples comparison, across customers, campaigns, vendors and B2B audiences.
To make this possible, I used my company’s technology (naturally) as a platform to measure and compare programs and consulted with industry experts on their view of digital performance and how they measured success. I was quite shocked by results from our benchmark, which included our own company’s campaigns.
Key Takeaways
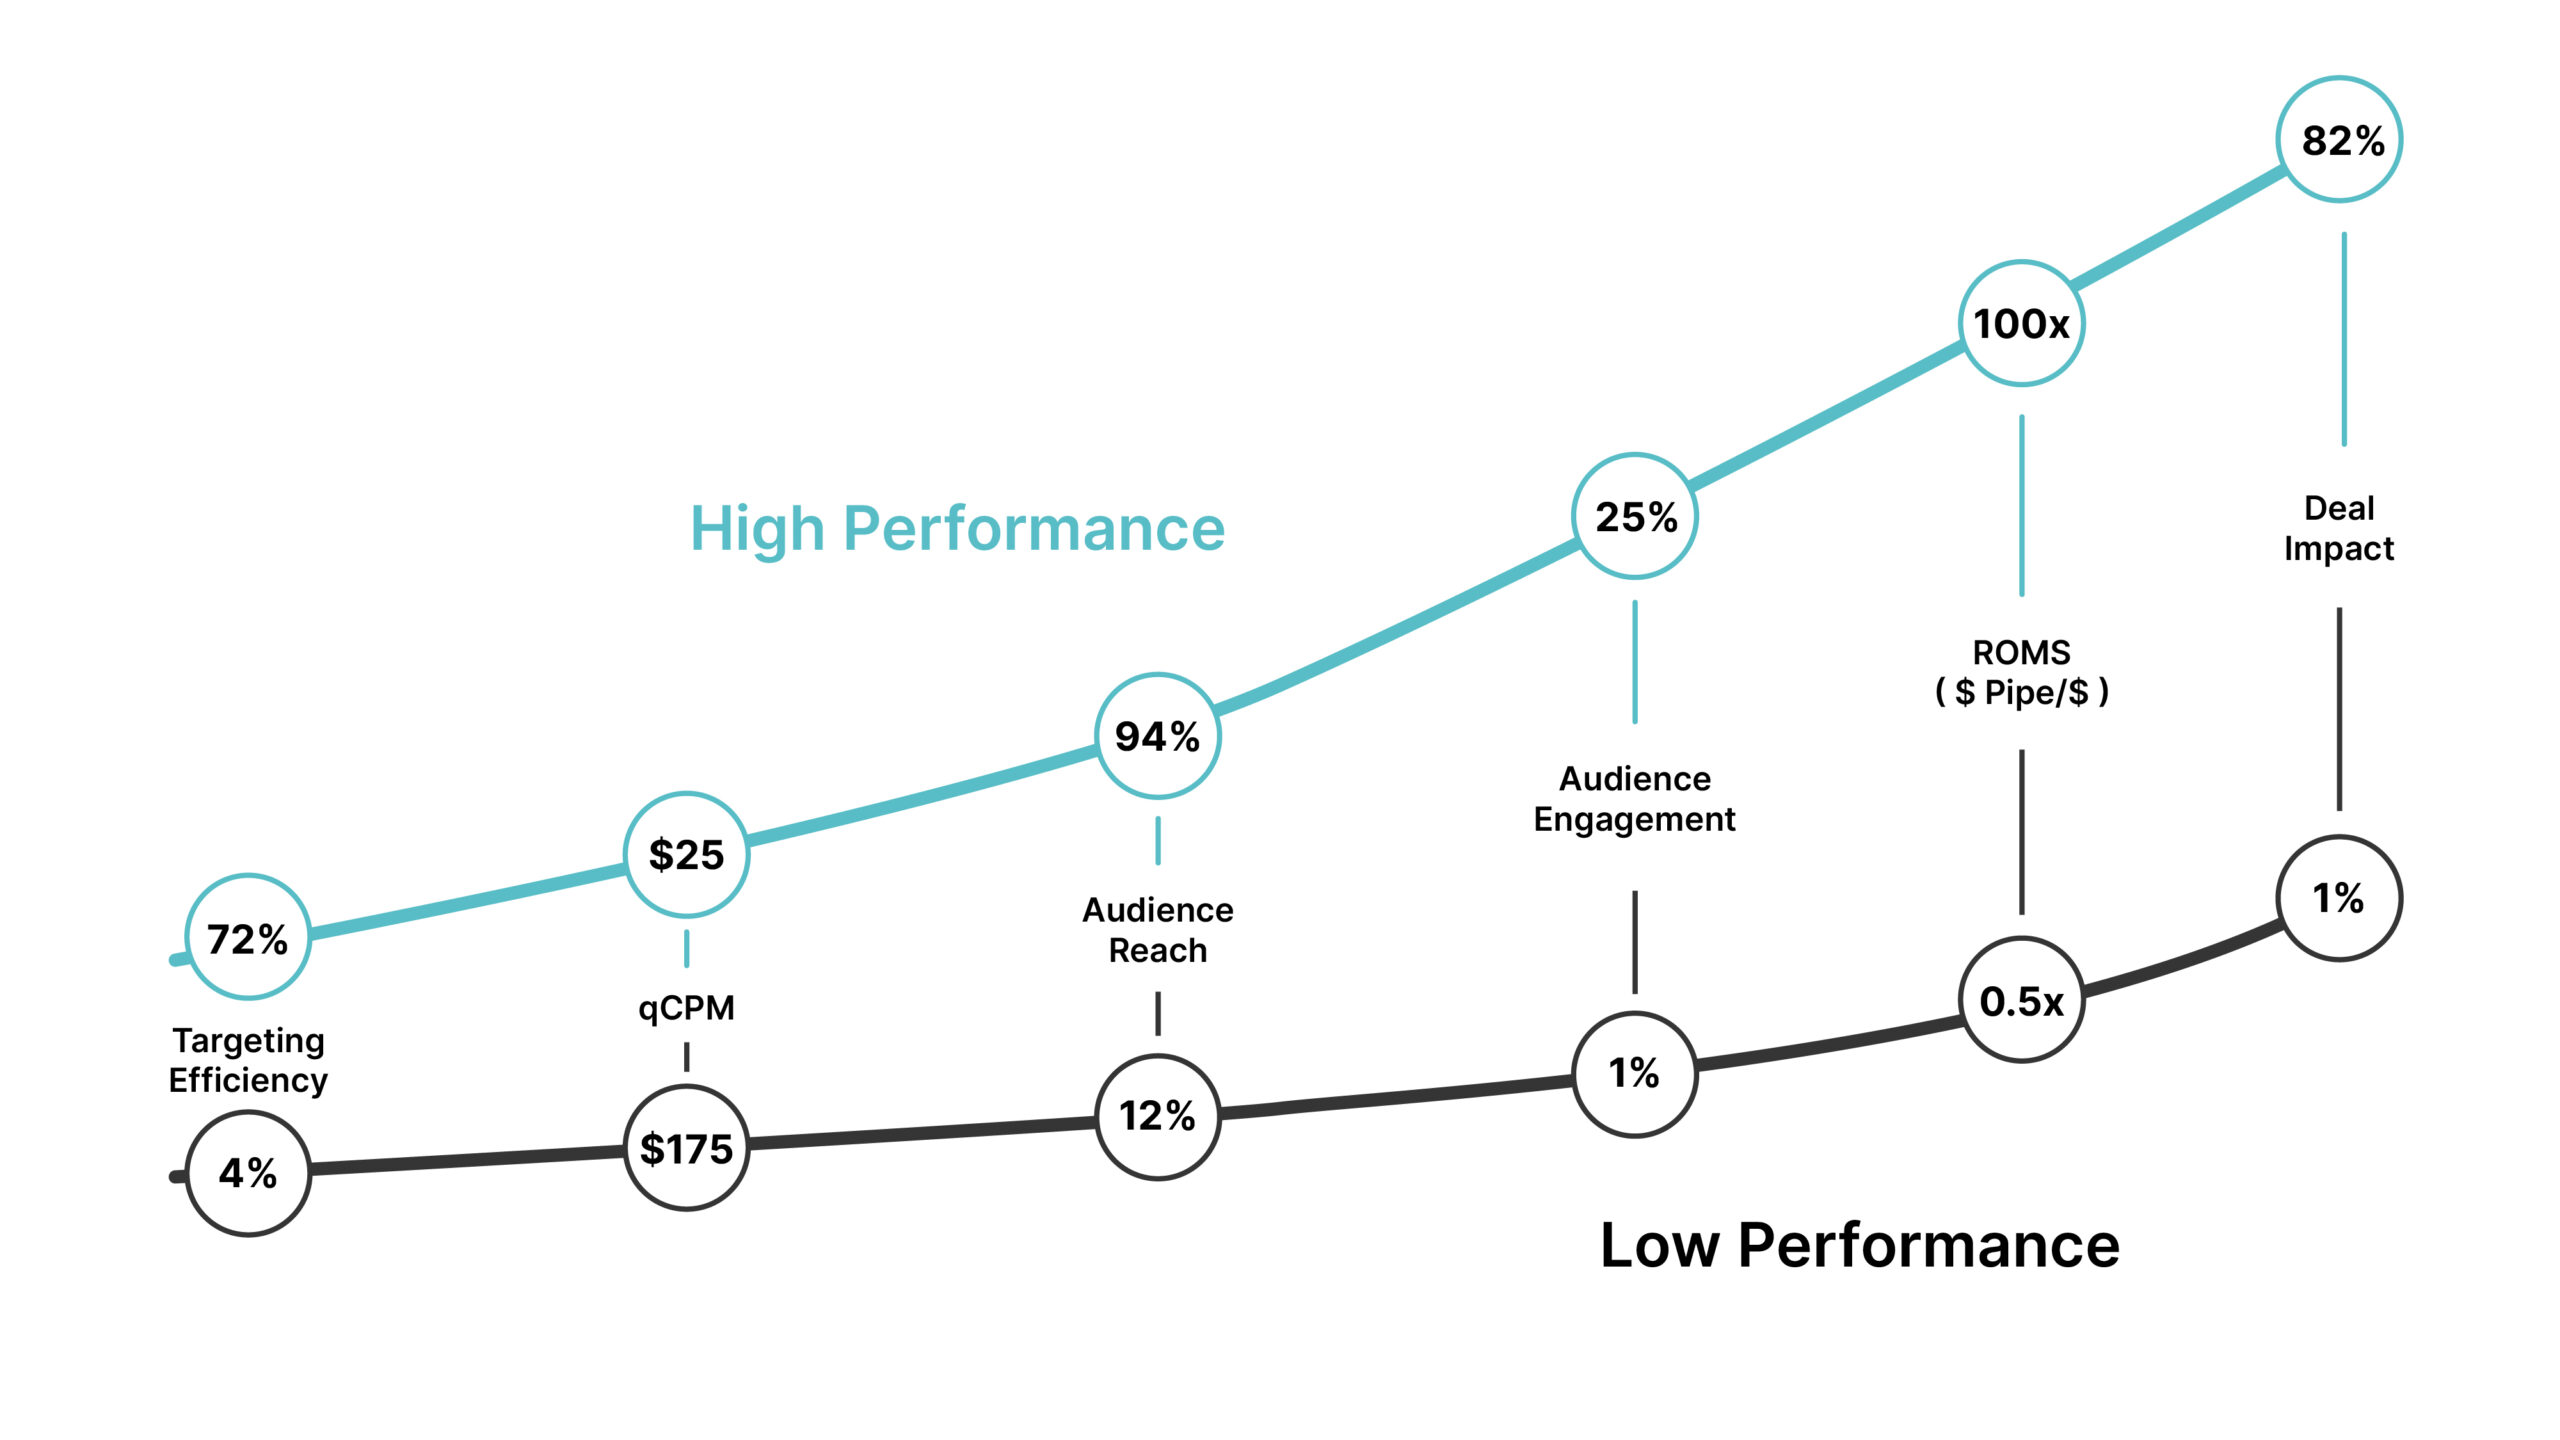
- Wrong Measurements. Most B2B marketers simply do not use a consistent set of KPI’s to measure the digital performance of their campaigns or vendors. Not too surprising, they lean toward the metrics that justify the campaign or make them look good internally. Relying solely on vendors to ‘grade their own homework’ was also a common mistake. To make the benchmarking valuable and actionable, we’ve established the six key performance metrics as the foundation for comparing B2B results. They are defined below and should be considered holistically to understand exactly what is working, and what is not.
- Technology Impact. Technologies built for targeting businesses generally offer superior financial efficiency and easily make up the difference in published CPM costs. I was surprised, however, that most B2B marketers rely on a stated CPM and do not adjust for wasted impressions in making a true dollar for dollar comparison in their technology choices. B2B audience management functionality often had the biggest impact on financial efficiency and business outcomes.
- Publisher Quality. Context and publisher quality do matter. The level of engagement from targeted accounts ranged nearly 25X between impressions served across business properties vs larger media platforms with less control where ads may be served. This range far exceeded the difference in the cost of impressions, and more importantly, had a more significant impact on key pipeline metrics. Social platforms and DSP’s with curated business properties drove much higher engagement
- Patience is a Virtue. Too often, marketers jumped to conclusions looking at a single measurement and wanted to claim success or stop a campaign too early. During several campaigns, we experienced lower than expected targeted efficiency, but Audience Reach and Engagement were excellent and ultimately led to much better business outcomes with more financially efficient pipeline generation.
- Range of Performance. Customers experienced a wide range of results that varied dramatically based on vendor, target audience, and/or the people managing the program. There was not a single marketer, customer or technology that consistently outperformed. What became clear, was the need to consistently measure programs on consistent KPI’s and not rely on individual vendor reporting.
Six KPI’s for Measuring B2B Digital Performance
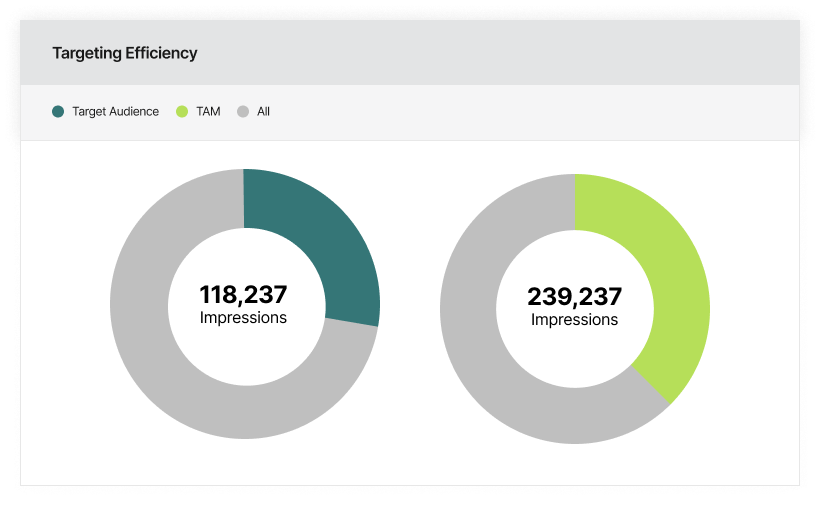
Targeting Efficiency – The % of impressions served that reach the intended audience of accounts. The spread here is largely dependent on the account identification capabilities and the ability to manage ad serving budgets by account.
qCPM – Similar to CPM (or cost per thousand impressions) but adjusted to measure the true cost of impressions reaching the target audience. “q” is for quality. A $10 CPM with 50% targeting efficiency would yield a qCPM of $20.
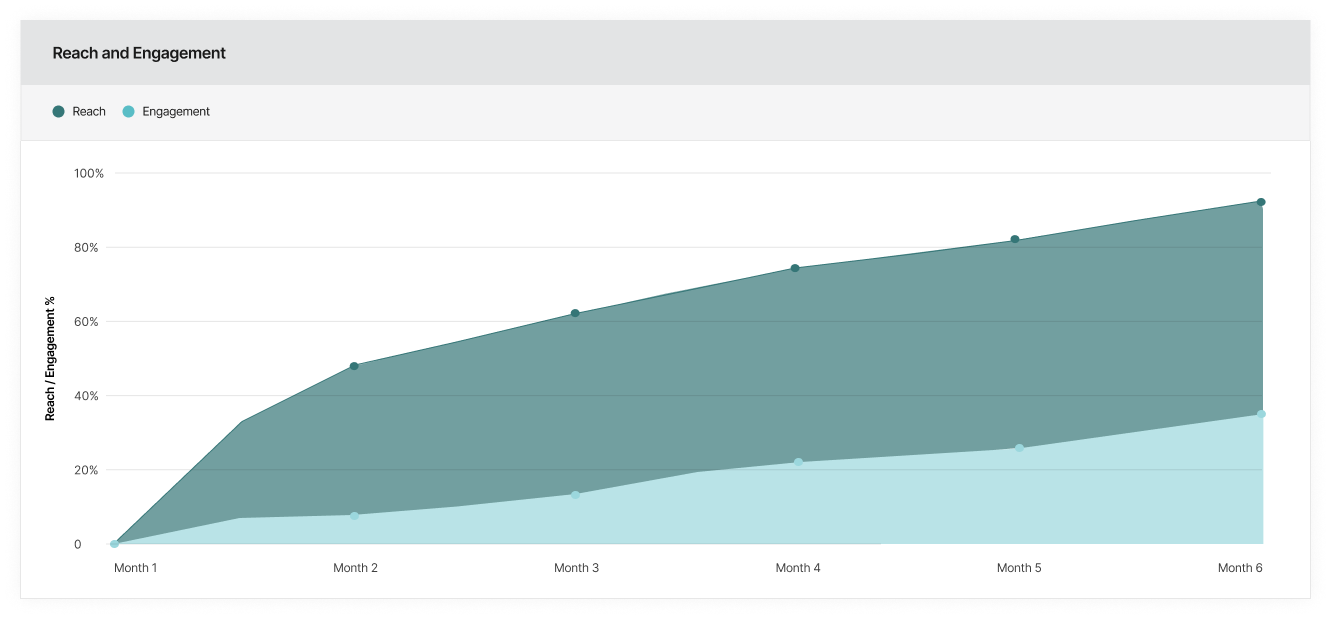
Audience Reach – The % of accounts in audience that are served impressions. Reaching 600 accounts with impressions on a list of 1,000 accounts would yield 60% Reach. Generally speaking, the ABM platforms do a good job reaching 90% of an audience within the first month of a program.
Audience Engagement – A subset of Reach, the % of an audience that engage with the customer’s website. Engagement can be modified to number of visits or time on site. We used a single visit in our definition. This KPI typically increases over time. Platforms with higher quality publishers and B2B walled gardens typically outperform.
ROMS (Return on Marketing Spend) – The $ amount of pipeline generated by engaged accounts divided by the amount of spend, within the same time period. Typically used to measure the performance of all marketing programs over time, it can also be used to rank vendors and shift budget.
Deal Impact – The % of deals closed in a specific time period that were influenced and engaged with impressions during the same period. Any vendor with 0%, or even less than 5%, influence on deals closed is an easy place to save money.
What’s next? Making it easier and easier to measure and compare marketing performance and be positioned to understand which technology or approach is best for marketing into a particular industry or target list of companies. A healthy level of benchmark data will also make it possible to say goodbye to traditional touch-based attribution models and leverage generative AI solutions and media mix models for more trustworthy and accurate marketing investment decisions.
If you would like a free audit of your digital programs, simply go to www.channel99.com and sign up for a trial.

