

It's time to better integrate finance into the world of marketing and sales. Here is one simple way to start building a common language.
I am always surprised at how difficult it is for finance and marketing to speak the same language when their collaboration is so critical to ensure sufficient investment to meet growth and other strategic goals. While leading Demandbase 10 years ago, I took it upon myself to help bridge the gap between these two groups and decided to include the entire company while I was at it. I felt like customer acquisition cost, or CAC, was a great place to start. So at a weekly Town Hall, I asked employees how much they thought it cost to acquire a new customer. As predicted, the guesses rolled in… $3,000, $7,000, and the highest guess was $15,000. Finance was not allowed to answer, but I could see them chuckling at the low guesses. Without revealing exact figures, I responded that it was currently cheaper to buy a Tesla than to acquire a new customer. Now I had everyone’s attention and all wanted to hear more.
Understanding the Financial Components of CAC
CAC is commonly calculated by dividing the total sales and marketing expenses from the previous period by the number of new customers acquired in the current period, typically one quarter. Many companies also remove the support and service expenses that might roll up to make the figure more accurate. So while CAC on its own is quite easy to measure, it is more insightful to understand what drives it up or down by its fixed and variable components.
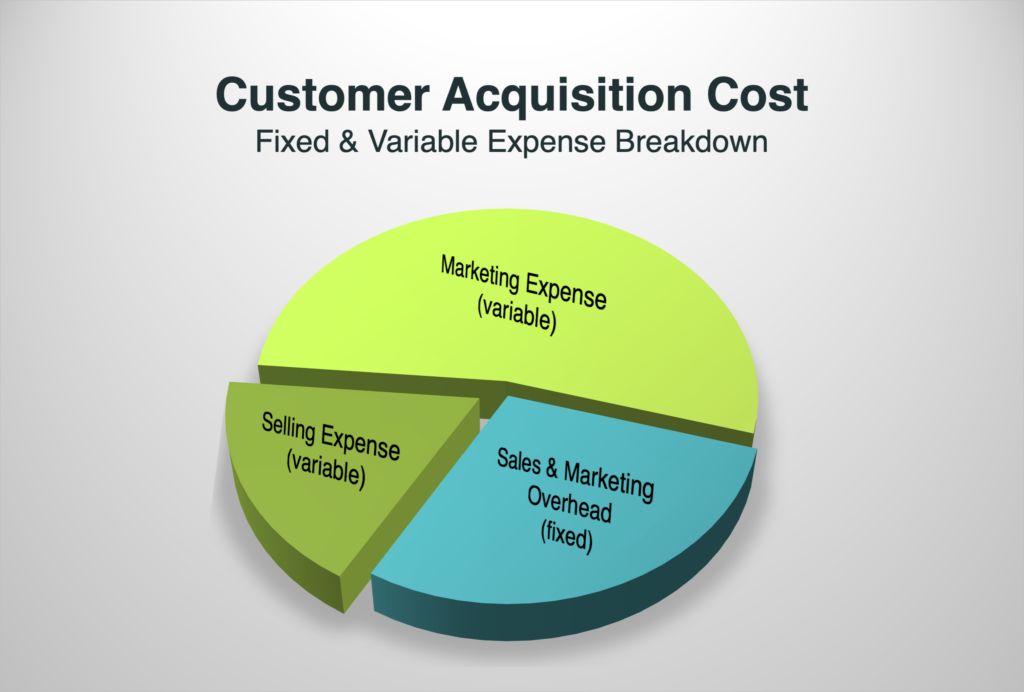
Specifically, I like to break it down into three: 1) Fixed sales and marketing overhead, 2) variable selling expense, and 3) variable marketing expense.
The fixed costs are essentially everything unrelated to generating pipeline and closing deals, and commonly include expenses for sales and marketing leadership, sales enablement, sales ops, corporate marketing, etc. While these expenses are not going to go up or down much quarter to quarter, this first fixed cost component of CAC generally declines as a company gets larger and the expense gets spread across more new logos.
Next is the selling expense, the first variable component, which is basically the loaded cost of a salesperson (including commissions) that goes into closing a deal. The easiest way to think about it is if a single salesperson makes $150,000 in a year with commissions and closes 10 deals, then their expense contribution to closing a customer is roughly $15,000. Rolling it up to a company level, it is the total cost for the whole sales team (less leadership and overhead) divided by the number of new logos acquired.
The third component is the variable marketing expense, which is probably the least understood by finance as it’s often managed in a black box spanning multiple channels, dozens of vendors, and a multitude of crisscrossing campaigns. It’s no wonder the finance team is frustrated during planning season when they are trying to cleanly map budgets to pipeline generation, bookings, and revenue. Rather than giving finance a clean pipeline acquisition cost, marketers often show off MQL cost and volume improvements; campaign results with likes, hearts, and shares; and maybe a dozen great pipeline wins with nothing definitive for finance to model. The result is a financial model based on what was spent last year with a percentage increase or decrease.
A Real-life Example
I was at a mid-size software company and the marketing team was celebrating that they exceeded their MQL goals at a cost of $2,000 each. While I always applaud hitting numbers, I asked the team what % turned into SQL (answer: 50%), what % turned into pipeline (answer: 50%), and then into a customer (answer: 20%). Alright, so with those conversion rates, the variable marketing spend to acquire a single customer cascades to $40,000, which in and of itself was a revelation to a team that was thinking of costs in four digits. And when you layer in the additional costs for things like the SDR team, that number jumped to $50,000. Now add the variable selling expense and S&M overhead and the company is spending more than $90,000 to acquire a customer with the largest component being variable marketing expense. Unfortunately the focus at this company was limited to MQL’s and not on the not bigger picture of customer profitability. I almost forgot to share that the average selling price of the company’s solutions was $30,000 making it nearly impossible for the company to make a profit for 3 years!
Bridging the Gap Between Marketing and Finance
The reality is that all the finance team wants is confidence that the money invested into variable marketing spend is going to efficiently and predictably generate the pipeline the sales team needs to meet or exceed their bookings or revenue. Finance and the CEO or CRO generally do not care about campaigns, MQLs, or how the definition changed so that conversions to SQLs are better next quarter. If marketers want to speak the language of finance and the C-suite, they need to start measuring and rewarding people on pipeline acquisition cost, variable marketing spend per opportunity, and how it’s going to scale so they can predictably do “more with less”.
How do we get there? Companies have to stop rewarding marketers purely on volume of MQLs because it drives bad behavior in most companies. Instead, they should transition to ROI-based incentives that align marketing and sales. That way, when marketing hits their numbers, sales is well-positioned to hit theirs as well. If finance then understands the business needs to invest $50,000 in variable marketing to generate a new deal, they can build that into their models with contingencies for efficiency gains or losses. Only then will finance and marketing better align and speak the same language. And, in the case of the earlier example, it will become more obvious that pricing, marketing and selling efficiency need to change dramatically.

